Are Pictures Worth A Thousand Words?
While yesterday’s topic (Triple Bottom Line) is still fresh in your mind, I thought I’d heap on a little fresh criticism.
This time, let’s take a look at some of the images that folks use to represent this otherwise rather unclear concept.
Here’s the graphic that Novo Ordisk (the pharmaceutical company) uses to explain 3BL: This is from Novo’s document, Novo Nordisk: Transparency Champion. They actually refer to it as “Triple Bottom Line Accounting.” Does that triangle look like an accounting method to you?
Here’s another triangle. This one’s from the Center for Sustainability at Aquinas College:
Not big on triangles? How about circles?
That’s from DNV Software. [Link repaired Nov. ’08]
How about something that shows, you know, the flow of it all?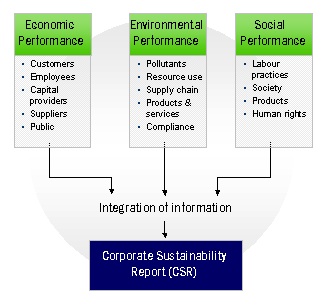 That’s from Ernst & Young. (From their page on Sustainability Management and Reporting.) Yup, Ernst & Young. Those guys are accountants. Surely they wouldn’t advocate a form of “accounting” where the items being counted don’t come in a common unit of measure…would they?
But really, it’s hard to beat this representation of 3BL: This “Triple Bottom Line Visual Framework” is from the Australian Government’s Department of the Environment & Heritage.
So, is a picture worth a thousand words? More like, how many thousand words would it take to begin to make sense out of these nonsense pictures?


Leave a comment